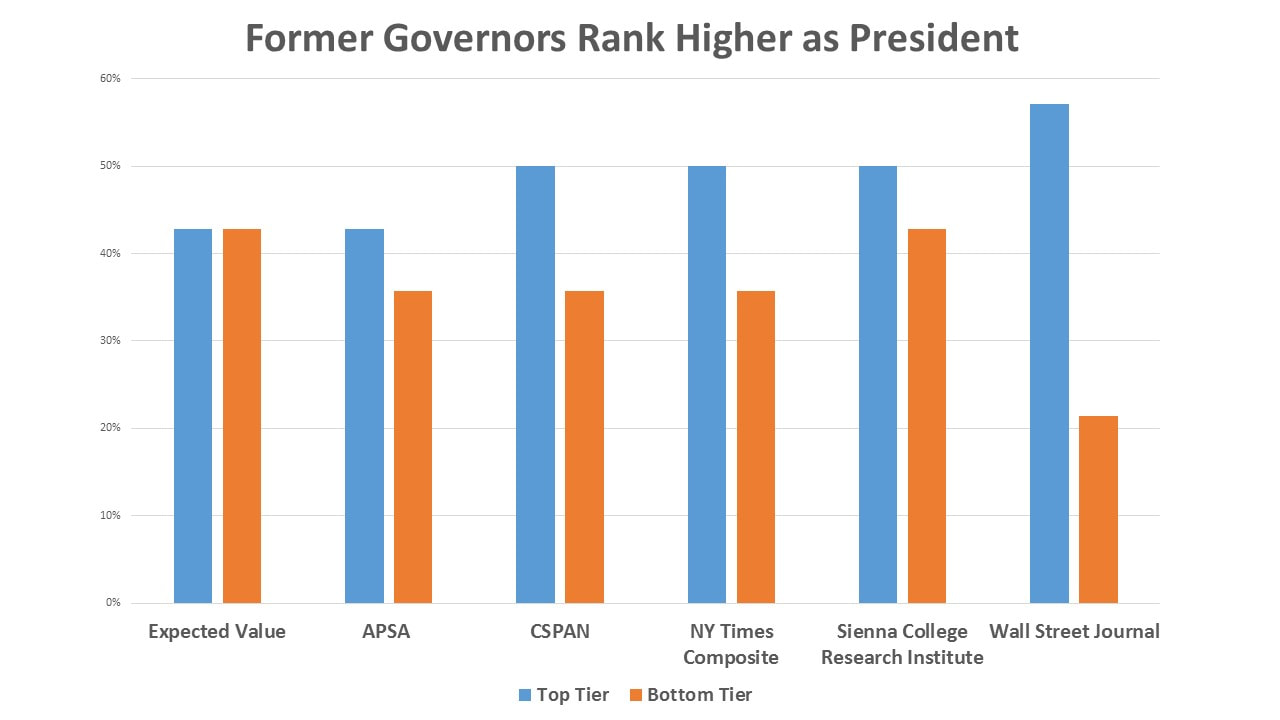
Last week, as I completed the 45-day series of accountabilitycitizenship.org blogs on each of our presidents, I was reminded that the historical record tells us about the job experience factors most likely to correlate to good performance as president.
This blog, first published in an AccountabilityCitizenship.org newsletter in 2015, compares experience factors—jobs held before becoming president—with five different rankings of the 42 presidents through George W. Bush. The goal is to identify specific job experiences that correlate with better or worse performance as president. Scholars may squabble over whether Roosevelt or Reagan was the better communicator, but there is no dispute over the fact that both were governors before they became president. Furthermore, most sources agree on the general ranking of presidents. In other words, even though scholars may disagree on the exact rank of individuals within the list of all presidents, there is significant consensus on who is in the top and bottom 14. Using five different rankings from distinct organizations provides some mitigation for the inevitable differences between rankings. The rankings used here are from the American Political Science Association (APSA) [Note 1], CSPAN [2], the New York Times (NYT [3], the Sienna College Research Institute (SCRI) [4], and the Wall Street Journal (WSJ) [5].
When I first published this blog in 2015, I chose to exclude President Obama from the set of presidents used for this analysis because he was still in office. This administrative move also left a pool of 42 past presidents—three equal tiers of 14 former chief executives. Using a pool of presidents that breaks down into three equal tiers simplified the statistical analysis across surveys without materially changing the results.
Of the 42 men who had held the office of President of the United States through President George W. Bush, 30 have been college graduates. Twenty-eight have been veterans of military service. Twenty-three served in one or both houses of Congress before becoming president. Twenty-two have studied or practiced law. Eighteen served as governors of states or territories. Fourteen held cabinet posts, 12 were general officers, and eight were ambassadors. We might expect these factors, or, in some cases, combinations of factors, to have affected the quality of job performance as president.
I determine if there is a correlation between a factor and performance by first calculating the percentage of presidents who share a particular factor or combination. For instance, as stated above, 30 of the presidents preceding President Obama have been college graduates, and 30 is 71 percent of the 42 presidents in this analysis. If graduating from college has no correlation to performance, we would expect 71 percent of the top, middle and bottom tiers of the population of presidents to be college graduates. Specifically, 71 percent of the 14 presidents in both the top and bottom tiers yields 9.9. Since it makes no sense to speak of a fraction of a president, I round up to get the expected value of ten college graduates in each tier. A positive correlation to any tier means a higher-than-expected number of presidents in that tier are college graduates. A negative correlation means a lower-than-expected number of presidents in that tier are college graduates.
Correlation is not causation. To say a positive correlation exists between a factor and a ranking does not mean the factor causes the ranking. A positive correlation may mean that a particular factor makes a ranking more likely.
At this point, the analysis is simply a factual discussion of correlations between experience factors and performance rankings within the group of past presidents. The claim that these historical correlations are likely to hold in the future is an example of inductive reasoning. Inductive reasoning can only establish that an outcome is more or less likely. It does not imply that any future outcome is certain. We use this type of reasoning all the time, however, to make decisions about what we will do in the future. In the financial sector, the standard disclaimer that “past performance is not a guarantee of future results” does not keep us from using past performance as one of our decision factors for how to invest. In a similar fashion, the correlations discussed here should be considered but one factor in a comprehensive evaluation of candidates.
Historically, the single experience factor I found most likely to result in a top-tier president is prior experience as governor of a state or territory. The pool of presidents I considered included 18 former governors—that is 42 percent of the 42 men who have served as chief executive prior to President Obama. However, the percentage of top-tier presidents with prior service as governors was greater than 42 percent in three of four surveys. If serving as a governor before becoming president did not affect performance as commander in chief, we would expect to find six prior governors in both top and bottom tiers. However, each of three rankings—the New York Times composite, the CSPAN ranking, and the Sienna College Research Institute ranking—all had seven former governors in the top tier. Only the American Political Science Association ranking had the expected value of six former governors in the top tier. Not only did prior experience as a governor make it more likely for past presidents to be top-tier, but three of four surveys also showed that presidents with prior experience as governors were less likely to be ranked in the bottom tier of all presidents than we would expect if governorship was a performance-neutral factor. Three surveys (NYT, APSA, and CSPAN) had five former governors in the bottom tier of presidents, while the Sienna College Research Institute ranking had the expected value of 6 former governors in the bottom tier. We might infer from this historical data that candidates with experience as governors are more likely to perform better than average while in office.
The exact opposite correlation holds for presidents who had prior experience as Members of Congress (either House, Senate, or both) without experience as a governor. The pool of presidents includes 23 former Members of Congress—that is 55 percent of the 42 men who have served as president through George W. Bush. If prior service as a Member of Congress was a performance-neutral factor, we would expect to find eight former Members of Congress in both top and bottom tiers—eight is the whole number closest to 55 percent of 14. However, only seven former Members of Congress appeared among the top-tier presidents in three rankings (NY Times Composite, CSPAN, Sienna College Research Institute). A fourth survey (American Political Science Association) had only six former presidents with prior service as a Member of Congress in the top tier. In addition, former Members of Congress were far more likely to appear in the bottom tier of presidents than we would expect if congressional experience was a performance-neutral factor. All four surveys had more than eight bottom-tier presidents with prior experience in Congress. In fact, three rankings (New York Times, American Political Science Association, Sienna College Research Institute) list 10 former Members of Congress in the bottom tier of presidents. The CSPAN survey lists nine former Members of Congress among the 14 lowest-ranked presidents. The fact that prior service in Congress carries a negative correlation for top-tier performance and an even stronger positive correlation for bottom-tier performance in the historical pool of presidents seems to imply that candidates with prior service in Congress (and no experience as governor) are more likely to be below-average performers as president.
These results have practical significance. As we prepare to start thinking about the 2020 presidential election, it is appropriate for both parties to look for candidates who have experience as governors. It is hard to imagine the board of directors of any major corporation choosing a chief executive without serious consideration of that executive’s past experiences and performance. Indeed, many corporations structure the careers of rising stars to create a pool of candidates with specific job experiences that correlate with success in the chief executive role. It is appropriate, then, for us to consider the correlations between experience factors and performance rankings among past presidents as we look to choose our next one.
[1] APSA, 2014; http://brook.gs/1AL8gcA.
2 CSPAN, 2009; "C-SPAN Survey of Presidential Leadership".
3 NYT, 2013; Silver, Nate (2013-01-23). “Contemplating Obama’s Place in History, Statistically.” The New York Times. http://nyti.ms/1Qnbfdj; The composite poll referenced in Silver’s article may be viewed at http://en.wikipedia.org/wiki/Historical_rankings_of_Presidents_of_the_United_States.`
4 SCRI, 2010; Thomas, G. Scott (2010-07-01). “Clean Sweep for the Roosevelts.” Business First of Buffalo. http://bit.ly/1Qma1ig;
5 WSJ, 2005; Taranto, James, “Presidential Leadership: How’s He Doing?” The Wall Street Journal, Sep 12, 2005. http://bit.ly/1KKKvVD
6 Grover Cleveland served 2 non-consecutive terms as the 22d and 24th president. Therefore, although President Obama was the 44th president, he was only the 43d person to hold the office.

 RSS Feed
